Quantcast
Channel: SSRS – Clint Huijbers' Blog
Viewing all 23 articles
Browse latest View live

SSRS: Multiple toolbar lines in Internet Explorer 11 (IE11)

$
0
0

An annoying issue is that on some clients, IE11 is displaying multiple lines for the toolbar buttons:

SSRS-IE11Issue-multiple-toolbar-lines

A work-around is to set the compatibility settings of IE11, more info on that here:
http://prologika.com/CS/blogs/blog/archive/2013/09/23/ie-11-issue-with-reporting-services.aspx

It seems to be fixed in the SP1 CU8 update:

Hello -

We are happy to inform that the problem was fixed in CU8 for SQL Server 2012 Sp1.
Please visit the http://support.microsoft.com/kb/2917531 to get the update.

Mariusz Cichomski
Program Manager
SQL Server, Microsoft

https://connect.microsoft.com/SQLServer/feedback/details/810527/sql-server-reporting-services-is-not-compatible-with-internet-explorer-11


SSRS hangs itself during rendering (IE11)

SSRS – Dataset: (Warning: Possible performance impact)

$
0
0

Today I just looked at it I guess, SSRS is actually complaining a lot:

Dataset: (Warning: Possible performance impact)

Every report @parameter that refers to a cube-related dataset somehow warns you every time…but why? Anyone an idea?
Even Google couldn’t give me an answer on that…

The cube’s performance is great, especially when just selecting a subset of values from a very small dimension (< 15 records).

ssrs-dataset-warning-possible-performance-impact

Any idea why SSRS does that??
Leave a comment!


SSRS: Easily calculate the difference between two fields/textboxes with an expression

$
0
0

This might seem to be a simple approach, but for some it takes to a while to figure out that such tricks are even possible in SSRS.
For example to calculate the difference/variance between Actual and Budget values in a report:

=ReportItems!Textbox50.Value - ReportItems!Textbox171.Value

SSRS-difference-between-two-textboxes-fields-values-variances-expression

Simply lookup the textbox’ name in the Properties-window:

SSRS-difference-between-two-textboxes-fields-values-variances-textbox-properties-name

This approach also works for ReportItems outside of the table/matrix (across the report even).
In some cases you’ll need to combine two KPI values from different matrixes/tables in the report and for example run another formula to come up with a definite rating/value.

Instead of ‘Fields!‘ use ‘ReportItems!‘ to refer to actual items on the report canvas (this can be on the header, footer or body of the report).
In my experience you may need to use a temporary hidden textbox to store the value temporary in order to use it in the header or footer. So in case you run into some sort of constraint, try this one out first.


SSRS MDX – Month/period parameter dataset (until current month + order descending)

$
0
0

Here’s how to accomplish this:
mdx-ssrs-month-period-until-now-order-descending-code

The results:
mdx-ssrs-month-period-until-now-order-descending-results

The code:

WITH MEMBER [Measures].[ParameterCaption] AS [Dim Period].[Period Description].CURRENTMEMBER.MEMBER_CAPTION
MEMBER [Measures].[ParameterValue] AS [Dim Period].[Id].CURRENTMEMBER.UNIQUENAME
MEMBER [Measures].[ParameterLevel] AS [Dim Period].[Id].CURRENTMEMBER.LEVEL.ORDINAL

SELECT
{
[Measures].[ParameterCaption], [Measures].[ParameterValue], [Measures].[ParameterLevel]
} ON COLUMNS,
ORDER([Dim Period].[Id].CHILDREN,[Dim Period].[Id].CurrentMember.Member_Name,DESC) ON ROWS
FROM
(
SELECT ( [Dim Period].[Id].&[200701] : StrToMember("[Dim Period].[Id].&[" + Format(Now(), "yyyyMM") + "]")
) ON COLUMNS
FROM [CUBE]
)


Protected: SSRS: SQL Agent Job Status report

$
0
0

This post is password protected. You must visit the website and enter the password to continue reading.


SSRS: Filter a dataset based on mulitple vales (for parameter values)

$
0
0

Here’s a simple trick to filter a dataset in SSRS based on multiple values (which can also be used to limit the number of parameter values).

ssrs-filter-dataset-parameter-on-multiple-values-in-operator-list-of-values

ssrs-filter-dataset-parameter-on-multiple-values-in-operator-properties-filter

The formula:
=Split("2013,2014",",")

ssrs-filter-dataset-parameter-on-multiple-values-in-operator-result


Protected: SSRS: SQL Agent Job Schedule Timeline report

$
0
0

This post is password protected. You must visit the website and enter the password to continue reading.


SSRS Parameter Expression: Previous Workday

$
0
0

Depends on whether your company works on a Saturday, but one of these SSRS Expressions will do the trick:

Basically WEEKDAY() will return the day number of the week, which will return:
– Sunday = 1
– Monday = 2
– etc.
(Doesn’t matter which Language (e.g. en-GB, etc.) you’ve set in the report)

So if you would like to select the previous workday (including Saturdays):

=IIF(WEEKDAY(TODAY())=2,
DATEADD("d",-CINT(WEEKDAY(TODAY())),TODAY()),
DATEADD("d",-1,TODAY())
)

‘In case it’s Monday, select Today’s date minus 2 days. Otherwise return yesterday’

If you would like to exclude the entire weekend:

=IIF(WEEKDAY(TODAY())=1 OR WEEKDAY(TODAY())=2,
DATEADD("d",-CINT(WEEKDAY(TODAY()))-1,TODAY()),
DATEADD("d",-1,TODAY())
)

‘In case it’s Sunday or Monday, select Today’s date minus 1 days and subtract rack the day number of the week. Otherwise return yesterday’


SSRS: Sum() LookupSet Function

$
0
0

Here’s a handy piece of coding which might help you:
http://salvoz.com/blog/2013/05/27/sum-result-of-ssrs-lookupset-function/

You may use the SumLookup function to sum the results from LookupSet:
=Code.SumLookup(LookupSet(Fields!Parent_Number,Fields!Parent_Number.Value,
Fields!StoreCount.Value, “StoreCount”))


Or use a combined ‘key’ to perform the lookup:
=Code.SumLookup(LookupSet(Fields!GroupName.Value & Fields!WeekNumber.Value,Fields!GroupName.Value & Fields!WeekNumber.Value,Fields!NrOfItems.Value,"DataSet1"))

Paste the following code in ‘Custom code’ field:

Function SumLookup(ByVal items As Object()) As Decimal
If items Is Nothing Then
Return Nothing
End If
Dim suma As Decimal = New Decimal()
Dim ct as Integer = New Integer()
suma = 0
ct = 0
For Each item As Object In items
suma += Convert.ToDecimal(item)
ct += 1
Next
If (ct = 0) Then return 0 else return suma
End Function


SSRS: Hide a Tablix is case no rows are displayed (row count after applying a filter)

$
0
0

Here’s the thing. In case you don’t use filters in your Tablix, you can easily run a count on the dataset. Like for example:
=IIF(CountRows("Dataset1") > 0, False, True)

But, in my case my Tablix has a couple of filters and this changes things.
In order to count the number of rows which the Tablix is actually using/displaying, you may want to use this expression for the Hide-property:
=IIF(CountRows() > 0, False, True)

ssrs-hide-tablix-when-no-records-returned


Copy/Pasting elements in SSRS…argh!

$
0
0

Report-builder-was-unable-to-paste-successfully

Report Builder was unable to paste successfully.

Hmmm….that one buggers me.
Turns out that it doesn’t like have custom code in elements which you would like to copy/paste.
It’s a known issue for years and has been reported, but they decided not to fix it…
https://connect.microsoft.com/SQLServer/feedback/details/767968/visual-studio-2008-unable-to-copy-and-paste-textboxes-in-ssrs-reports-with-custom-code-after-2008-r2-sp2-upgrade

So what’s the work-around you might ask? Well…you’ll need to comment out all the ‘Code.’-sections in the XML code of the report.

Workaround:

Step 1) Open up the XML view for the report, either in Visual Studio by right clicking the report and selecting View Code, or by editing in any text editor.
Comment out Code. blocks. Ctrl + F your way through the document looking for Code.. The goal is to preserve the code in some way, while temporarily commenting out the line. Depending on your actual code, this might be different, but I here’s what I like to do:

Step 2)
Find: =Code.
Replace With: =’Code.

Step 3) Go back to the Designer View and Copy and Paste the Tablix. You can do this by right clicking the top left corner of the tablix control: Copy Tablix

Step 4) Go back to the XML View and reverse the find and replace
Find: =’Code.
Replace With: =Code.


Visual Basic code
Another things it that is has a habit of putting Visual Basic code in front of your SSRS expression, like for example:

Microsoft.VisualBasic.Information.
Microsoft.VisualBasic.Interaction.
Microsoft.VisualBasic.Strings.
Microsoft.ReportingServices.RdlObjectModel.ExpressionParser.VBFunctions.

When you copy/paste anything, afterwards view the XML code and just replace remove these strings with Find&Replace.


ReportItems!Textbox.Value
In case your using ReportItems!Textbox.Value, make sure to check a few that Visual Studio ‘changed’ the number accordingly. Don’t know why, but most of the time it does understand the logic and also adjusts the textbox-numbers accordingly. But sometimes it doesn’t :)


SSRS image with transparent background

$
0
0

ssrs-image-with-transparant-background-example

What?
Sounds easy but actually if you use an image which has transparent areas, ie. has one color which will be transparent, the transparent pixels will be colored in with the page background color.

Why?
I want an image to display per row as a status marker for 3 different types of results: Success, Failure, Unknown. My images are circles with the background being transparent. I want the first column to display an image based on the status result.

If I simply insert an image, the report would use the background color of the report.

How?
The issue exists if your image has transparent areas but displays the report background color instead:

1) Right-click on the cell you want to put the image in.

2) Insert > Rectangle

3) Set the Rectangle Fill color (I’m using an expression based on the status) to output: Green (for Success), Red (for Fail), Orange (for Unknown).

4) Right-click on the rectangle and select Insert > Image

5) Edit the Image Properties to specify the image to use.

The image can be an expression as well (I embed these and then refer to them in the expression by name). For example:
=IIF(Fields!SummaryStatus.Value="Success", "status_ok", IIF(Fields!SummaryStatus.Value="Unknown", "status_unknown", "status_fail"))

ssrs-image-with-transparant-background


Thanks to Joël Lipman.


Here’s another cool example on how to use transparency within a SSRS report:
http://cm-bloggers.blogspot.nl/2010/10/using-transparent-background-in.html


How to design your SSRS or Power BI dashboard

$
0
0

Here’s how you should design your SSRS of Power BI dashboard (thanks to Julie Koesmarno).
More info on her blog:
http://www.mssqlgirl.com/power-bi-in-a-jiffy-composition-in-power-view.html

To my delight, she mentioned about composition, in particular Fibonacci Spiral. It reminded me of one of the fundamental things that I have learned in photography (as a hobby). So this weekend, I spent a bit of time reviewing some of the data visualisations in Power View that I have created in the past. Instead of just looking at it as just data and information, I put my “amateur” photographer eyes on this. I begin thinking about design, technical and most importantly business components and how to put them together.

Here are a couple of Before-And-Afters, where I have revisited the objectives and composition aspects of these data visualisations in Power View.

Before and After

Before-and-After-design-ssrs-power-bi-dashboards

Fibonacci spiral is a pretty cool thing to use / apply in composition. Use it wisely and when it works, it works really well. Not all visualisations have to fit Fibonacci spiral though :)

Another example based on a photo:

how-it-is-done-in-photography

More tips for photography (and dashboards):
http://photo-typ.blogspot.nl/2013/08/golden-rule-of-thirds-and-fibonacci.html

Another interesting blog post by Jason Thomas (also HowTo’s):
http://www.sqljason.com/2013/05/a-sample-ssrs-dashboard-and-some-tips.html

Dashboard-design-nice


Data driven subscriptions cannot be created because the credentials used to run the report are not stored,the report is using user-defined parameters values, or if a linked report, the link is no longer valid.

$
0
0

Well SSRS is stil bugging you huh?

ssrs-data-driven-subscription-cannot-be-created-user-defined-parameter-values

There are a few things you may need to check:

1) Make sure that you’ve stored the credentials of the data source IN the report

2) Since the data-driven subscription is running without an actual user-context, the use of User!UserID is not allowed.

Start by adding this custom code to your report (under ‘Report Properties‘ -> ‘Code‘):

Public Function UserName()
Try
Return Report.User!UserID
Catch
Return "System"
End Try
End Function

Now you need the find: User!UserID

And replace it by: code.UserName()

in the Code-view of the report.


SSRS Heat Map in a Table or Matrix

$
0
0

Today I wanted to create a Heat Map (not the geographical one, but in a matrix) and stumbled upon this blog post:
http://www.arrangeactassert.com/how-to-create-heat-maps-in-sql-server-reporting-services/

It uses the colors from green to red, but I’m more of a subtle guy who wants to use softer tones for that. So I picked my own set of pre-defined colors for the VB code to use and here is it:

ssrs-heat-map-matrix-table-code-example

Code:

Public Function GetHeatmapColor(ByVal textBoxValue, ByVal minDataSetValue, ByVal maxDataSetValue) As String
Dim colours As String() = New String() {"White", "WhiteSmoke", "Gainsboro", "Silver", "DarkGray"}
If textBoxValue = 0 Then
Return colours(0)
End If
If minDataSetValue = maxDataSetValue Then
Return colours(0)
End If
If textBoxValue > maxDataSetValue Then
Return colours(colours.Length - 1)
End If
Dim divider As Decimal = (maxDataSetValue - minDataSetValue + 1) / 4
Dim index As Decimal = (textBoxValue - minDataSetValue) / divider
GetHeatmapColor = colours(index)
End Function

Simply copy/paste this code into Report Properties -> Code and use this expression for your BackgroundColor of the cell in your matrix or table:


=Code.GetHeatmapColor(Sum(Fields!NumberOfUsers.Value), Min(Fields!NumberOfUsers.Value, "DataSet1"), Max(Fields!NumberOfUsers.Value, "DataSet1"))

Note: In my case I set the minimum to 8.0 to ignore very low values which will mess up the color scheme.


SSRS – Report Execution Analysis

$
0
0

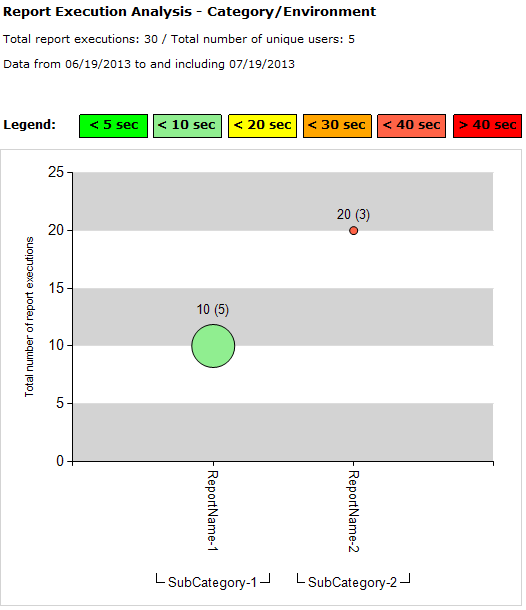
A little while ago, I made a report to analyze the usage of SSRS report (users and rendering times).

Here’s how it works:
The vertical axis displays the total number of report executions, while the size (and (x) number) displays the total number of unique users.
And not to forget, color of the balloons is based on the average rendering time of that specific report.

Report Execution Analyses explanation

It is pretty straight forward on how to implement it.

Download
Download the SQL Stored Procedures and SSRS report RDL-file here:
ReportExecutionAnalysis.zip


Other reports
Have a look at other reports I’ve published for my readers:

SQL Agent Job Schedule Timeline report

sql-agent-job-schedule-timeline-report


SQL Agent Job Status report

sql-agent-jobs-report


SSRS: NaN, Infinity or even #Error

$
0
0

I’ve seen many IIF’s, CASE-statements, +0.00001 additions and others to suppress or solve one of these ‘errors':
NaN, Infinity or even #Error

Let’s start with the basics, when do these things emerge and why?
Normally, you get NaN when trying to divide 0 / 0 or Infinity when you are dividing any number by 0.

I personally use this function to overcome such obstacles:
Public Function Divide(ByVal dividend As Double, ByVal divisor As Double) As Double
If IsNothing(divisor) Or divisor = 0 Or IsNothing(dividend) Or dividend = 0 Then
Return 0
Else
Return dividend / divisor
End If
End Function

And here’s how you should use it:
=Code.Divide(X,Y)

Other more creative solutions are:
=REPLACE(X/Y,"NaN","0")
Or:
=IIF(Y = 0, 0, X/Y)
Or:
=Switch(
X/Y = "NaN",Nothing,
X/Y = "Infinity",Nothing,
X/Y = "Infinity",Nothing
)


SSRS: Windows Authentication connection to SMTP server

$
0
0

In order to get SSRS to use Windows Authentication to setup a connection with your local SMTP, you’ll need to modify the rsreportserver.config.

The ‘rsreportserver.config’-file is located in: X:\Program Files\Microsoft SQL Server\MSRS1111.MSSQLSERVER\Reporting Services\ReportServer

Open the file and look for ‘SMTPAuthenticate‘:

SSRS SMTP configuration


By default it is empty, but you’ll need to set it to ‘2‘.

More info about this property: https://msdn.microsoft.com/en-us/library/ms159155(v=sql.120).aspx#bkmk_options_local_SMTP

SMTPAuthenticate specifies how the report server connects to the remote SMTP server. The default value is 0 (or no authentication). In this case, the connection is made through Anonymous access. Depending on your domain configuration, the report server and the SMTP server may need to be members of the same domain.
To send e-mail to restricted distribution lists (for example, distribution lists that accept incoming messages only from authenticated accounts), set SMTPAuthenticate to 2.

IMPORTANT: After you’ve saved the configuration-file, don’t forget to restart the SSRS service on your server.


SSRS Drill-through: passing multiple values to another report (MDX list of values)

$
0
0

When I build large dashboards, I often fall back to basic stored procedures to combine datasets, but also to be able to manipulate parameter values (month, first week, previous week, previous year totals, etc.).
An annoying thing is that when you want to create a drill-though action to another report which uses MDX, you’ll need to magically join these values.

Well…here’s how you could achieve it.
Let’s say I have these three values (keys): XXX, YYY and ZZZ

MDX expects a prefix and a suffix (according to the dimension properties/levels).
So here’s what MDX expects:

[Dim Customer].[Customer Number].&[XXX]
[Dim Customer].[Customer Number].&[YYY]
[Dim Customer].[Customer Number].&[ZZZ]

Important: MDX expects different objects/rows, like you need to use separate rows in VS/SSDT for the default parameter values.

Your dataset returns the basic key values, first step is to join these (including the prefix and suffix):

="[Dim Customer].[Customer Number].&["+JOIN(Parameters!Customer.Value,"], [Dim Customer].[Customer Number].&[")+"]"

The results is:

[Dim Customer].[Customer Number].&[XXX],[Dim Customer].[Customer Number].&[YYY],[Dim Customer].[Customer Number].&[ZZZ]

Which seems correct, but MDX isn’t expecting a multi-valued string (compared to SP’s).

Final thing, you’ll need to do is to split it again in order to provide a record/row per value:

=Split("[Dim Customer].[Customer Number].&["+JOIN(Parameters!Customer.Value,"], [Dim Customer].[Customer Number].&[")+"]",",")


Viewing all 23 articles
Browse latest View live